A Comparison of Caucasian and Korean Hair Density, Follicular Density, and Calculated Density; A Compelling Argument for Individual Follicular Group Harvesting
Numerous investigators have estimated donor area hair density and follicular density over the years. No published study to date has attempted to objectively quantify the total follicular density in the donor area. Numerous individuals have estimated follicular hair density in the Korean population, but no one has compared Korean densities with Caucasian densities using similar objective methods to measure these densities. The purpose of this study is to more accurately estimate hair density and follicular density in a finite surface area of the donor region and to compare these results in both Korean and Caucasian populations using the same method of measurement.
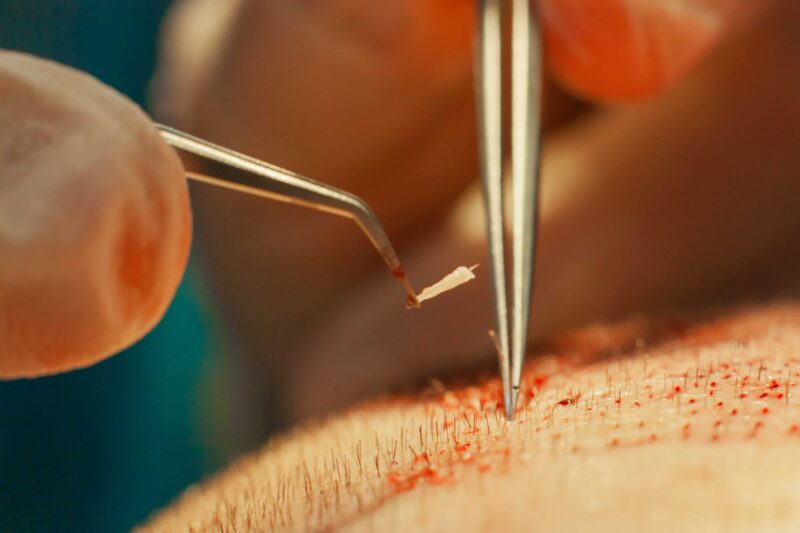
In addition to estimating the total number of follicular groups in the donor area, this study attempted to define the mean number of hairs per follicular group (calculated density) pre-operatively.1 We also evaluated the mean number of hairs per follicular group extracted by a method of individual follicular group harvesting (IFGH), commonly called follicular unit extraction or the FUE hair transplant technique, known as the Cole Isolation Technique (CIT®) and compared them to the donor area calculated densities that were determined pre-operatively.2,3 The purpose of this later comparison was to determine if there were specific advantages to this method of IFGH harvesting over strip-donor harvesting.
The results of this objective study showed that Korean follicular density and hair density is higher than previously reported in Asian patients. Caucasian hair density and follicular density are higher than in Korean people, but the difference is not as great as previously reported. Previous studies have shown that IFGH produces more hair per graft than does strip harvesting. This study re-confirms that IFGH does offer an advantage over traditional strip harvesting in that it produces more hair per follicular group and a higher percentage of follicular groups containing multiple hairs the distribution of grafts produced.
Objective
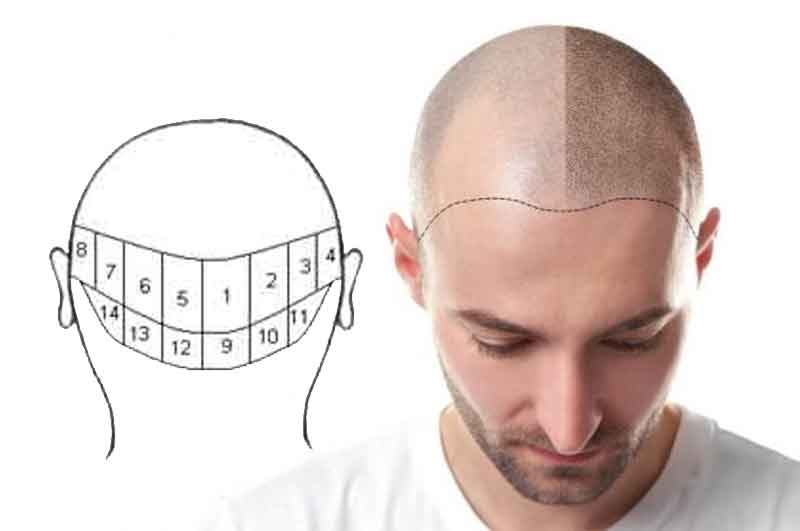
The donor area was divided into 14 regions of a specified size using a donor area template shown in Figure 1 (Device4Hair). There were 8 major regions and 6 minor regions as depicted in Figure 2. The major regions occupied the superior borders, while the minor regions occupied the inferior borders of the donor template. The intersection between the two borders lies along with the occipital notch along a line extending to a point 2 to 3 cm superior to the helix. The 8 major regions correspond to the current location where strip harvesting is traditionally performed. The eight major regions are numbered one through eight with numbers 1, 2, 3, and 4 on the right side of the scalp and regions 5, 6, 7, and 8 on the left side of the scalp.

Figure 1. Donor area template showing the size and location of 8 major regions and six minor regions.

Figure 2. The location of the 14 regions on the scalp with 8 major regions (number 1 – 8) superiorly and 6 minor regions (number 9 – 14) inferiorly.
Follicular density and hair density was measured using a 3.57 mm diameter circle, whose surface area is 10 square millimeters. This was done with a 30X handheld microscope (Radio Shack Cat No 63-851). The number of hairs and the number of follicular groups in 10 square millimeters within each region was noted and recorded in the Donor Area Analysis Sheet (Device4hair) shown in Figure 3. The mean follicular density in square centimeters within each circle was estimated by multiplying the number of follicular groups in the 10 square millimeter circles by 10. The total number of follicular groups within each region was estimated by multiplying the mean follicular density in each region by the surface area of each region. The number of hairs per square centimeter was determined by multiplying the total number of hairs in the 10 square millimeter circles by 10. The estimated total number of follicular groups in the donor area was defined by summing the estimated number of follicular groups in all 14 regions of the donor area. Calculated density has previously been defined as the number of hairs in each follicular group. 1 The calculated density was defined by dividing the total number of hairs in the 10 square millimeter circle by the total number of follicular groups in the 10 square millimeter circle. The calculated density estimates the mean number of hairs per follicular group. The mean calculated density of the entire donor region was obtained by taking the average of all the calculated densities in the 14 regions of the donor area.

Figure 3. Donor area analysis sheet
<hrdata-mce-alt=”follicular-density” class=”system-pagebreak” title=”follicular density” />
The mean follicular density in each population of patients for all 14 regions was obtained by averaging the individual follicular densities of each region in both patient populations.
Grafts were obtained using a sharp punch method of IFGH extraction known as the Cole Isolation Technique, which is a proprietary system of FUE. Precisely varying the geometry of the punches used for extraction and precisely varying the method of the extraction minimized follicle transetion rates insured removal of intact follicular groups.
Upon removal of the follicular groups, the number of hairs in each group was determined under a Meji EMT dissecting microscope under 10X magnification. The number of hairs in each follicular group was noted. The total number of one, two, three, four, five, and six hair follicular groups were recorded for each patient. The relative frequency of each size group was totaled and the percentage of each size follicular group for each Korean patient. The overall frequency of each size follicular group was determined by averaging the number of each size follicular group in the Korean patient.
The total evaluated donor area measured 203 cm2. By multiplying the total donor area evaluated by the mean calculated density, we were able to quantify the total number of potential hairs available for transplantation in both the Korean and Caucasian populations.
| Patient | Region 1 | Region 2 | Region 3 | Region 4 | Region 5 | Region 6 | Region 7 | Region 7 | Total Major |
| 1 | 1575 | 1680 | 1680 | 1680 | 1575 | 1890 | 1680 | 1680 | 13440 |
| 2 | 1225 | 1470 | 1470 | 1470 | 1400 | 1680 | 1470 | 1470 | 11655 |
| 3 | 1750 | 1680 | 1680 | 1680 | 1400 | 2100 | 1680 | 1470 | 13440 |
| 4 | 1400 | 1680 | 1680 | 1470 | 1225 | 1680 | 1470 | 1470 | 12075 |
| 5 | 1750 | 1890 | 1680 | 1680 | 1575 | 1890 | 1890 | 1890 | 14245 |
| 6 | 1225 | 1470 | 1680 | 1470 | 1400 | 1680 | 1470 | 1470 | 11865 |
| 7 | 1400 | 1680 | 1890 | 1680 | 1400 | 1680 | 1890 | 1680 | 13300 |
| 8 | 1400 | 1680 | 1470 | 1680 | 1575 | 1680 | 1470 | 1470 | 12425 |
| 9 | 1225 | 1680 | 1680 | 1470 | 1400 | 1890 | 1470 | 1470 | 12285 |
| 10 | 1575 | 1680 | 1680 | 1470 | 1400 | 1680 | 1680 | 1890 | 13055 |
| 11 | 1225 | 1470 | 1470 | 1260 | 1225 | 1680 | 1470 | 1470 | 11270 |
| 12 | 1400 | 1680 | 1470 | 1680 | 1400 | 1680 | 1680 | 1680 | 12670 |
| 13 | 1575 | 1890 | 1680 | 1680 | 1575 | 1890 | 1890 | 1680 | 13860 |
| 14 | 875 | 1050 | 1260 | 1050 | 1225 | 1260 | 1050 | 1050 | 8820 |
| 15 | 1575 | 1890 | 1890 | 1680 | 1575 | 1890 | 1890 | 1680 | 14070 |
| 16 | 1575 | 2100 | 2100 | 2100 | 1750 | 2100 | 2100 | 2100 | 15925 |
| 17 | 1575 | 1470 | 1470 | 1260 | 1575 | 1680 | 1470 | 1680 | 12180 |
| 18 | 1575 | 2100 | 1680 | 1680 | 1750 | 1890 | 1680 | 1890 | 14245 |
| 19 | 1750 | 1680 | 1890 | 1680 | 1575 | 2100 | 2100 | 1680 | 14455 |
| 20 | 1225 | 1470 | 1260 | 1470 | 1225 | 1470 | 1470 | 1470 | 11060 |
| 21 | 1400 | 1680 | 1890 | 1680 | 1575 | 1680 | 1680 | 1680 | 13265 |
| 22 | 1400 | 1680 | 1890 | 1890 | 1400 | 1470 | 1680 | 1470 | 12880 |
| 23 | 1750 | 1890 | 2100 | 1890 | 1575 | 1890 | 1890 | 1890 | 14875 |
| 24 | 1750 | 2100 | 1890 | 1680 | 1750 | 2100 | 2310 | 1890 | 15470 |
| 25 | 1400 | 1680 | 1680 | 1260 | 1225 | 1470 | 1680 | 1680 | 12075 |
| 26 | 1400 | 1680 | 1470 | 1680 | 1400 | 1470 | 1470 | 1470 | 12040 |
| 27 | 1575 | 1470 | 1470 | 1470 | 1400 | 1470 | 1680 | 1470 | 12005 |
| 28 | 1050 | 1260 | 1050 | 1260 | 875 | 1050 | 1260 | 1260 | 9065 |
| 29 | 1400 | 1470 | 1680 | 1470 | 1400 | 1470 | 1470 | 1470 | 11830 |
| 30 | 1575 | 1890 | 1890 | 1680 | 1750 | 2100 | 2100 | 1890 | 14875 |
| 31 | 1750 | 1680 | 1470 | 1470 | 1575 | 2100 | 1680 | 1680 | 13405 |
| 32 | 1750 | 2520 | 2520 | 2520 | 2275 | 2520 | 2520 | 2520 | 19145 |
| 33 | 1400 | 1890 | 1680 | 1470 | 1400 | 1680 | 1680 | 1470 | 12670 |
| 34 | 1575 | 2100 | 1680 | 1680 | 1750 | 1890 | 1680 | 1680 | 14035 |
| 35 | 1225 | 1680 | 1680 | 1470 | 1225 | 1470 | 1470 | 1470 | 11690 |
| 36 | 1400 | 1680 | 1680 | 1470 | 1400 | 1680 | 1680 | 1680 | 12670 |
| 37 | 1400 | 1680 | 1680 | 1470 | 1400 | 1470 | 1470 | 1470 | 12040 |
| 38 | 1225 | 1680 | 1470 | 1680 | 1225 | 1470 | 1470 | 1260 | 11480 |
| 39 | 1750 | 1890 | 1680 | 1470 | 1575 | 1680 | 1680 | 1470 | 13195 |
| 40 | 1575 | 1890 | 1890 | 1470 | 1575 | 1890 | 1680 | 1680 | 13650 |
| 41 | 1225 | 1680 | 1680 | 1680 | 1225 | 1680 | 1470 | 1470 | 12110 |
| 42 | 1750 | 1890 | 1890 | 1890 | 1750 | 1890 | 1890 | 1890 | 14840 |
| 43 | 1750 | 1680 | 1890 | 1680 | 1575 | 2100 | 2100 | 1680 | 14455 |
| 44 | 1400 | 1680 | 1680 | 1680 | 1400 | 1470 | 1470 | 1680 | 12460 |
| 45 | 1225 | 1680 | 1470 | 1260 | 1225 | 1470 | 1470 | 1260 | 11060 |
| 46 | 1750 | 2310 | 2520 | 2100 | 1750 | 2310 | 2100 | 2100 | 16940 |
| 47 | 1750 | 1890 | 1890 | 1680 | 1400 | 1890 | 1890 | 1680 | 14070 |
| 48 | 1575 | 1680 | 1680 | 1470 | 1400 | 1680 | 1680 | 1470 | 12635 |
| 49 | 1575 | 2100 | 2100 | 1890 | 1575 | 1680 | 1680 | 1890 | 14490 |
| 50 | 1750 | 2310 | 1890 | 1890 | 1750 | 1890 | 1890 | 1890 | 15260 |
| 51 | 1225 | 1470 | 1680 | 1470 | 1400 | 1680 | 1470 | 1470 | 11865 |
| 52 | 1400 | 1890 | 1890 | 1680 | 1575 | 1680 | 1680 | 1680 | 13475 |
| 53 | 1575 | 1890 | 1470 | 1470 | 1400 | 1680 | 1470 | 1470 | 12425 |
| 54 | 1575 | 1890 | 1680 | 1470 | 1547 | 1890 | 1890 | 1470 | 13412 |
| 55 | 1750 | 1890 | 1680 | 1680 | 1750 | 1890 | 1890 | 1680 | 14210 |
| 56 | 1225 | 1470 | 1470 | 1470 | 1260 | 1225 | 1470 | 1470 | 11060 |
| 57 | 1575 | 1680 | 1680 | 1680 | 1575 | 1890 | 1680 | 1680 | 13440 |
| 58 | 1575 | 2100 | 1680 | 1680 | 1750 | 1890 | 1680 | 1890 | 14245 |
| 59 | 1750 | 1470 | 1680 | 1680 | 1400 | 1680 | 1680 | 1680 | 13020 |
| 60 | 1225 | 1890 | 1890 | 1470 | 1400 | 1470 | 1470 | 1680 | 12495 |
| 61 | 1575 | 1890 | 1680 | 1680 | 1575 | 1680 | 1890 | 1680 | 13650 |
| 62 | 1925 | 2100 | 2310 | 2100 | 1750 | 2100 | 2100 | 2100 | 16485 |
| 63 | 1400 | 1680 | 1470 | 1470 | 1050 | 1470 | 1470 | 1470 | 11480 |
| 64 | 1400 | 1680 | 1680 | 1470 | 1400 | 1680 | 1470 | 1470 | 12250 |
| Average | 1,490 | 1,762 | 1,710 | 1,608 | 1,482 | 1,735 | 1,687 | 1,634 | 13,133 |
Table 1. The number of follicular groups for the Eight Major Regions in Caucasian Patients.
The Caucasian mean follicular densities for the six minor regions are noted in Table 2. In addition, the total number of follicular groups is noted for each patient in the minor regions along with the grand total of follicular groups for each patient. The mean number of follicular groups for each minor region is noted at the bottom of the table, as is the mean grand total for all 64 patients. The mean total for the six minor regions totaling 42 cm2 in Caucasian patients was 3,508 follicular groups. The mean total number of follicular groups in the 203 cm2 evaluated in the study group was 16,649 follicular groups.
| Patient | Region 9 | Region 10 | Region 11 | Region 12 | Region 13 | Region 14 | Total Minor | Grand Total |
| 1 | 700 | 700 | 700 | 770 | 770 | 630 | 4270 | 17710 |
| 2 | 560 | 560 | 490 | 420 | 560 | 560 | 3150 | 14805 |
| 3 | 560 | 560 | 490 | 560 | 490 | 560 | 3220 | 16660 |
| 4 | 630 | 560 | 630 | 630 | 560 | 560 | 3570 | 15645 |
| 5 | 560 | 560 | 490 | 560 | 490 | 490 | 3150 | 17395 |
| 6 | 560 | 490 | 420 | 420 | 420 | 490 | 2800 | 14665 |
| 7 | 700 | 700 | 700 | 630 | 630 | 6730 | 10090 | 23390 |
| 8 | 560 | 490 | 490 | 560 | 490 | 490 | 3080 | 15505 |
| 9 | 560 | 560 | 490 | 560 | 490 | 490 | 3150 | 15435 |
| 10 | 560 | 630 | 490 | 560 | 490 | 420 | 3150 | 16205 |
| 11 | 420 | 560 | 490 | 490 | 490 | 420 | 2870 | 14140 |
| 12 | 700 | 630 | 560 | 630 | 630 | 560 | 3710 | 16380 |
| 13 | 700 | 700 | 490 | 700 | 700 | 560 | 3850 | 17710 |
| 14 | 490 | 490 | 490 | 420 | 420 | 420 | 2730 | 11550 |
| 15 | 770 | 700 | 560 | 770 | 560 | 630 | 3990 | 18060 |
| 16 | 840 | 840 | 770 | 840 | 770 | 770 | 4830 | 20755 |
| 17 | 560 | 490 | 490 | 490 | 490 | 490 | 3010 | 15190 |
| 18 | 560 | 630 | 560 | 630 | 560 | 630 | 3570 | 17815 |
| 19 | 700 | 630 | 560 | 630 | 560 | 560 | 3640 | 18095 |
| 20 | 630 | 560 | 490 | 560 | 490 | 490 | 3220 | 14280 |
| 21 | 490 | 560 | 560 | 560 | 630 | 630 | 3430 | 16695 |
| 22 | 560 | 560 | 490 | 630 | 560 | 490 | 3290 | 16170 |
| 23 | 700 | 630 | 560 | 630 | 560 | 630 | 3710 | 18585 |
| 24 | 630 | 630 | 490 | 630 | 630 | 560 | 3570 | 19040 |
| 25 | 630 | 630 | 630 | 630 | 560 | 630 | 3710 | 15785 |
| 26 | 560 | 560 | 490 | 560 | 490 | 490 | 3150 | 15190 |
| 27 | 490 | 490 | 490 | 490 | 420 | 490 | 2870 | 14875 |
| 28 | 420 | 280 | 350 | 280 | 280 | 350 | 1960 | 11025 |
| 29 | 490 | 490 | 490 | 560 | 560 | 490 | 3080 | 14910 |
| 30 | 630 | 560 | 630 | 560 | 700 | 490 | 3570 | 18445 |
| 31 | 630 | 560 | 490 | 560 | 560 | 560 | 3360 | 16765 |
| 32 | 770 | 840 | 840 | 910 | 840 | 770 | 4970 | 24115 |
| 33 | 560 | 490 | 490 | 630 | 560 | 560 | 3290 | 15960 |
| 34 | 560 | 560 | 630 | 490 | 490 | 490 | 3220 | 17255 |
| 35 | 490 | 490 | 560 | 420 | 490 | 560 | 3010 | 14700 |
| 36 | 560 | 560 | 560 | 560 | 490 | 560 | 3290 | 15960 |
| 37 | 560 | 560 | 560 | 630 | 560 | 630 | 3500 | 15540 |
| 38 | 490 | 490 | 490 | 490 | 490 | 490 | 2940 | 14420 |
| 39 | 630 | 560 | 490 | 630 | 630 | 490 | 3430 | 16625 |
| 40 | 630 | 630 | 630 | 700 | 560 | 560 | 3710 | 17360 |
| 41 | 560 | 560 | 490 | 560 | 490 | 490 | 3150 | 15260 |
| 42 | 700 | 700 | 630 | 700 | 700 | 700 | 4130 | 18970 |
| 43 | 700 | 630 | 560 | 630 | 560 | 560 | 3640 | 18095 |
| 44 | 770 | 560 | 490 | 700 | 560 | 560 | 3640 | 16100 |
| 45 | 560 | 490 | 420 | 490 | 420 | 350 | 2730 | 13790 |
| 46 | 630 | 630 | 630 | 700 | 630 | 630 | 3850 | 20790 |
| 47 | 490 | 560 | 560 | 490 | 490 | 490 | 3080 | 17150 |
| 48 | 630 | 490 | 490 | 560 | 490 | 560 | 3220 | 15855 |
| 49 | 700 | 630 | 630 | 630 | 630 | 630 | 3850 | 18340 |
| 50 | 700 | 560 | 490 | 630 | 490 | 490 | 3360 | 18620 |
| 51 | 560 | 560 | 490 | 560 | 560 | 490 | 3220 | 15085 |
| 52 | 560 | 560 | 540 | 560 | 560 | 490 | 3270 | 16745 |
| 53 | 560 | 560 | 490 | 700 | 560 | 490 | 3360 | 15785 |
| 54 | 630 | 560 | 490 | 630 | 700 | 700 | 3710 | 17122 |
| 55 | 630 | 560 | 630 | 630 | 560 | 560 | 3570 | 17780 |
| 56 | 490 | 490 | 420 | 560 | 490 | 420 | 2870 | 13930 |
| 57 | 700 | 700 | 700 | 770 | 770 | 630 | 4270 | 17710 |
| 58 | 560 | 630 | 560 | 630 | 560 | 630 | 3570 | 17815 |
| 59 | 560 | 490 | 630 | 560 | 630 | 630 | 3500 | 16520 |
| 60 | 490 | 490 | 560 | 490 | 490 | 490 | 3010 | 15505 |
| 61 | 630 | 630 | 560 | 630 | 560 | 490 | 3500 | 17150 |
| 62 | 630 | 630 | 630 | 630 | 560 | 630 | 3710 | 20195 |
| 63 | 630 | 420 | 560 | 490 | 420 | 420 | 2940 | 14420 |
| 64 | 630 | 560 | 490 | 560 | 490 | 490 | 3220 | 15470 |
| Average | 602 | 575 | 545 | 592 | 555 | 639 | 3,508 | 16,649 |
Table 2. Number of Follicular Group Density for the Six Minor Regions in Caucasian Patients and the total number of follicular groups for all 14 regions.
The number of follicular groups for all eight Korean major regions are noted in Table 3. This table notes the total number of follicular groups in each region for all 30 Korean patients. The mean number of follicular groups in these 8 regions was 12,527 follicular groups.
| Patient | Region 1 | Region 2 | Region 3 | Region 4 | Region 5 | Region 6 | Region 7 | Region 8 | Total Major |
| 1 | 1225 | 2100 | 1680 | 1260 | 1225 | 1680 | 1260 | 1680 | 12110 |
| 2 | 1575 | 1890 | 1680 | 1470 | 1225 | 1890 | 1470 | 1890 | 13090 |
| 3 | 1575 | 1890 | 1470 | 1260 | 1575 | 2100 | 1680 | 1680 | 13230 |
| 4 | 1400 | 1680 | 1890 | 1470 | 1225 | 1470 | 1470 | 1260 | 11865 |
| 5 | 1400 | 1890 | 1680 | 1680 | 1400 | 2100 | 1470 | 1260 | 12880 |
| 6 | 1575 | 1890 | 1680 | 1890 | 1400 | 1680 | 1890 | 1470 | 13475 |
| 7 | 1575 | 1890 | 1470 | 1470 | 1400 | 1680 | 1680 | 1680 | 12845 |
| 8 | 1225 | 1470 | 1260 | 1260 | 1050 | 1260 | 1050 | 1470 | 10045 |
| 9 | 1400 | 1890 | 1470 | 1470 | 1575 | 1680 | 1890 | 1470 | 12845 |
| 10 | 1400 | 1890 | 1890 | 1680 | 1750 | 1890 | 1890 | 1470 | 13860 |
| 11 | 1575 | 1680 | 1680 | 1470 | 1400 | 1680 | 1470 | 1470 | 12425 |
| 12 | 1225 | 1050 | 1680 | 1260 | 1225 | 1470 | 1470 | 1260 | 10640 |
| 13 | 1400 | 1470 | 1260 | 1890 | 1225 | 1470 | 1260 | 1680 | 11655 |
| 14 | 1225 | 1470 | 1470 | 1260 | 1225 | 1680 | 1260 | 1470 | 11060 |
| 15 | 1225 | 1890 | 1680 | 1470 | 1400 | 1470 | 1470 | 1680 | 12285 |
| 16 | 1575 | 2100 | 1680 | 1470 | 1575 | 1680 | 2100 | 1890 | 14070 |
| 17 | 1225 | 1680 | 1890 | 1260 | 1225 | 1680 | 1470 | 1470 | 11900 |
| 18 | 1680 | 1680 | 1470 | 1470 | 1890 | 1680 | 1470 | 1260 | 12600 |
| 19 | 1400 | 1890 | 1470 | 1470 | 1225 | 1680 | 1680 | 1260 | 12075 |
| 20 | 1750 | 1890 | 2100 | 1470 | 1575 | 1680 | 1680 | 1470 | 13615 |
| 21 | 875 | 1470 | 1680 | 1470 | 1050 | 1260 | 1470 | 1470 | 10745 |
| 22 | 1750 | 1890 | 1470 | 1470 | 1750 | 2100 | 1680 | 1470 | 13580 |
| 23 | 1400 | 1890 | 1680 | 1470 | 11225 | 1680 | 1470 | 1470 | 22285 |
| 24 | 1225 | 2100 | 1890 | 1680 | 1400 | 1890 | 1680 | 1680 | 13545 |
| 25 | 1225 | 1680 | 1470 | 1680 | 1400 | 1470 | 1680 | 1470 | 12075 |
| 26 | 875 | 1260 | 1260 | 1050 | 1050 | 1050 | 1260 | 1050 | 8855 |
| 27 | 1400 | 1470 | 1680 | 1470 | 1400 | 1890 | 1680 | 1680 | 12670 |
| 28 | 1575 | 1260 | 1470 | 1260 | 1050 | 1470 | 1050 | 1680 | 10815 |
| 29 | 1400 | 1260 | 1260 | 1050 | 1400 | 1680 | 1260 | 1470 | 10780 |
| 30 | 1225 | 1680 | 1680 | 1470 | 1225 | 1470 | 1470 | 1680 | 11900 |
| Average | 1386 | 1708 | 1603 | 1449 | 1691 | 1652 | 1526 | 1512 | 12527 |
Table 3. Number of Follicular Groups for the 8 major regions in Korean patients and the mean total number of follicular groups in the 8 major regions for Korean patients.
The number of follicular groups in all six minor regions for the 30 Korean patients studied is noted in Table 4. This table includes the mean number of follicular groups for each of the six regions. The mean number of follicular groups in the six minor regions for the Korean study group was 3,191 follicular groups. The mean total number of follicular groups in all 14 regions for the Korean study groups was 15,718 follicular groups.
| Patient | Region 9 | Region 10 | Region 11 | Region 12 | Region 13 | Region 13 | Total Minor | Grand Total |
| 1 | 630 | 490 | 560 | 700 | 560 | 630 | 3570 | 15680 |
| 2 | 630 | 630 | 630 | 490 | 560 | 630 | 3570 | 16660 |
| 3 | 560 | 490 | 560 | 560 | 490 | 490 | 3150 | 16380 |
| 4 | 560 | 420 | 490 | 490 | 490 | 350 | 2800 | 14665 |
| 5 | 630 | 490 | 420 | 490 | 630 | 420 | 3080 | 15960 |
| 6 | 560 | 560 | 630 | 630 | 560 | 560 | 3500 | 16975 |
| 7 | 700 | 560 | 420 | 630 | 560 | 490 | 3360 | 16205 |
| 8 | 980 | 980 | 840 | 980 | 700 | 420 | 4900 | 14945 |
| 9 | 630 | 630 | 420 | 630 | 560 | 420 | 3290 | 16135 |
| 10 | 560 | 560 | 560 | 560 | 420 | 490 | 3150 | 17010 |
| 11 | 490 | 490 | 560 | 490 | 420 | 490 | 2940 | 15365 |
| 12 | 490 | 560 | 420 | 490 | 630 | 420 | 3010 | 13650 |
| 13 | 420 | 420 | 420 | 630 | 350 | 420 | 2660 | 14315 |
| 14 | 490 | 560 | 490 | 490 | 630 | 490 | 3150 | 14210 |
| 15 | 980 | 560 | 420 | 840 | 420 | 490 | 3710 | 15995 |
| 16 | 560 | 560 | 210 | 560 | 560 | 245 | 2695 | 16765 |
| 17 | 700 | 490 | 560 | 700 | 560 | 630 | 3640 | 15540 |
| 18 | 630 | 700 | 630 | 560 | 560 | 490 | 3570 | 16170 |
| 19 | 490 | 420 | 420 | 560 | 490 | 490 | 2870 | 14945 |
| 20 | 560 | 560 | 560 | 700 | 490 | 560 | 3430 | 17045 |
| 21 | 490 | 490 | 420 | 490 | 490 | 490 | 2870 | 13615 |
| 22 | 560 | 560 | 420 | 560 | 490 | 490 | 3080 | 16660 |
| 23 | 560 | 560 | 490 | 560 | 560 | 490 | 3220 | 25505 |
| 24 | 560 | 490 | 560 | 630 | 560 | 420 | 3220 | 16765 |
| 25 | 490 | 560 | 490 | 490 | 490 | 560 | 3080 | 15155 |
| 26 | 420 | 420 | 350 | 420 | 350 | 280 | 2240 | 11095 |
| 27 | 560 | 560 | 560 | 490 | 700 | 560 | 3430 | 16100 |
| 28 | 560 | 560 | 490 | 490 | 490 | 560 | 3150 | 13965 |
| 29 | 560 | 420 | 280 | 490 | 420 | 350 | 2520 | 13300 |
| 30 | 560 | 420 | 420 | 560 | 490 | 420 | 2870 | 14770 |
| Average | 586 | 539 | 490 | 579 | 523 | 475 | 3191 | 15718 |
Table 4. Number of Follicular Groups for the 6 minor regions in Korean Patients and the total number of follicular groups for all 14 regions.
Table 5 is a comparison of the mean follicular density of the eight major regions of Both Caucasians and Koreans. It also compares the mean number of follicular groups in each of the eight major regions of Caucasians and Koreans. The total number of follicular groups in the eight major regions for Koreans and Caucasians is also compared in this table.
| Population | Region 1 | Region 2 | Region 3 | Region 4 | Region 5 | Region 6 | Region 7 | Region 8 | Total Major |
| Caucasian | 1,490 | 1,762 | 1,710 | 1,608 | 1,482 | 1,735 | 1,687 | 1,634 | 13,133 |
| Korean | 1386 | 1708 | 1603 | 1449 | 1691 | 1652 | 1526 | 1512 | 12527 |
Table 5. Comparison of the number of follicular groups in the eight major regions between Caucasian and Korean patients.
Table 6 is a comparison of the mean number of follicular groups in all six minor regions of Caucasians and Koreans. It also includes a comparison of the total follicular groups from all 14 regions and the total mean number of follicular groups in both Caucasians and Koreans.
|
Population |
Region 9 |
Region 10 |
Region 11 |
Region 12 |
Region 13 |
Region 13 |
Total Minor |
Grand Total |
| Caucasian | 602 | 575 | 545 | 592 | 555 | 639 | 3,508 | 16,649 |
| Korean | 586 | 539 | 490 | 579 | 523 | 475 | 3191 | 15718 |
Table 6. Comparison of the six minor regions mean number of follicular groups in Caucasian and Korean patients along with the total number of follicular groups in the minor region and in the entire 203 cm2 donor area.
Table 7 compares the mean follicular density in both Koreans and Caucasians. The mean follicular density was taken pre-operatively with a 10X microscope, which was previously described. The mean follicular density is an average of all 14 regions. Taking the mean from all 14 regions in a similar fashion derived the mean hair density. The mean calculated density was obtained by dividing the mean hair density by the mean follicular density.
|
Population |
Mean Follicular Density in cm2 |
Hair Density in cm2 |
Mean Calculated Density in mm2 |
|
Caucasian | 81.37 | 193.07 | 2.37 |
|
Korean | 74.81 | 165.29 | 2.21 |
Table 7. Comparison of the mean follicular density, the mean hair density, and the mean calculated density in the 14 regions of the donor area pre-operatively in Caucasian and Korean patients.
Table 8 notes the distribution of follicular groups by size that was extracted from Korean patients by IFGH in the 30 Korean patients studied. The number of each size was calculated for each of the 30 Korean patients studied and the mean of each size is noted in Table 8.
|
1 hair |
2 hair |
3 hair |
4 hair |
5 hair |
6 hair | |
|
Percent | 2.15 | 44.71 | 47.02 | 5.57 | 0.55 | 0 |
Table 8. Mean percentage of follicular groups with respect to the number of hairs in each group in the 30 Korean patients studied
Discussion
Table 8. Mean percentage of follicular groups with respect to the number of hairs in each group in the 30 Korean patients studied
Table 8 notes the distribution of follicular groups by size that was extracted from Korean patients by IFGH in the 30 Korean patients studied. The number of each size was calculated for each of the 30 Korean patients studied and the mean of each size is noted in Table 8.
Most hair transplant procedures today involve the removal of donor tissue from the donor area with a scalpel. The typical donor area runs along the occipital scalp to a point superior to each ear. This line ranges from 28 to 30 centimeters generally. In our experience, the mean length was 28 centimeters but occasionally was up to 30 centimeters. Some physicians extend the line an additional centimeter anterior to the external auditory meatus bilaterally and some make the incision slightly more vertical laterally in an effort to increase the length of this line up to 34 centimeters.4 The typical strip harvest is between one to two centimeters in width.
In this study, the length of the donor area was 28 centimeters, which corresponds to the average length of a strip harvest. Generally speaking, the strip incision occurs within the 8 major zones depicted in this study. The eight major zones comprise 161 cm sq. It is felt that one can usually take ½ of this surface area and still have enough hair to cover the resulting strip scar. In other words, it is possible to remove 80.5 square centimeters and still have adequate coverage for the strip scar. Removal of a single strip 28 centimeters long and 1 cm wide removes 28 cm sq, while a 28 cm X 2cm wide strip removes 56 cm sq. The maximal width that can be removed and still leave 80.5 square centimeters above the incision is 2.875 cm. It may be possible to take as much as 119 square centimeters, which would leave 42 cm sq above the strip scar and 42 cm sq below the incision scar in the occipital and mastoid regions. This would correspond to a width of 4.2 cm. This would be possible provided there is adequate scalp laxity along with other ideal donor area conditions, and the strip scar remains covered. Unfortunately, the authors are not familiar with any such endeavor to date. Additional variables to consider with regard to strip scar exposure are the width of the scar, the color of the scar, degree of curl, and the caliber of the hair. The width of the strip scars is unpredictable. With more and more width excised, strip scars have a tendency to widen up to 0.5 cm in width though some physicians create scars in excess of 1 cm in width. Wider strip scars require a greater number of hairs to conceal them and tend to limit the total amount of donor tissue that can be excised. Coarse hair will generally cover much better than fine hair such that it is easier to conceal a strip scar provided the hair is coarse. Higher hair densities provide more hair mass and make it easier to conceal strip scars. Better hair characteristics and ideal circumstances may someday allow the physician to take up to 119 square centimeters of the donor area, while less favorable characteristics will make it less probable that such widths are possible. The total width of the excision affects the resulting width of the scar. Greater overall widths tend to produce wider scars.
Based on the mean follicular density and the mean calculated density in this study, the average 28 cm X 1 cm strip will produce the following number of follicular groups and hairs:
| Caucasian | 2278 FG | 5,400 Hairs |
| Asian | 2,095 FG | 4,630 Hairs |
The following discussion pertains to Caucasians although a similar argument could be generated for Asian patients. The maximal number of grafts than can be obtained in the average patient from 80.5 cm sq is 6,550 and the maximal number of hairs is 15,524. This probably represents the average maximal number of follicular groups and hairs possible from strip surgery. Graft counts, on the other hand, are generally higher than the total number of follicular groups. This occurs because physicians are rarely involved in the production of their grafts. Surgical technicians with variable levels of experience and training are generally the ones who dissect the strip into individual grafts. Based on numerous studies, experienced technicians produce a mean of 2.0 hairs per graft.3 With the removal of a strip, the total number of available hairs removed does not vary, but the number of grafts produced and the number of hairs transferred varies based on how the grafts are dissected by technicians, who have variable degrees of experience and training. If the average graft contains 2.0 hairs, but the average follicular group contains 2.37 hairs, then 0.37 hairs are removed from each graft. For example, if you have three follicular groups containing a 3, 2, and 3 hair respectively, then the average is 2.67 hairs per group. However if in the dissection process, you turn these three follicular groups into grafts containing 3, 2, 1, and 2 hair respectively, the average becomes 2.0 hairs per graft. This in fact is what happens in many strip surgeries as the percentage of one hair and two hair grafts far exceed the percentage of 1 and two hair groups in the donor area. The authors’ term this practice fractionation of the follicular group. Thus, if you assume that you can excise 80.5 cm, under acceptable donor circumstances (laxity, density, hair caliber, hair length, wave), then the average strip surgery clinic should produce 7762 hair grafts averaging 2.0 hairs per graft that total 15,524 hairs. Of course, waste from graft production in strip harvesting is generally not accounted for because physicians do not cut the grafts. Nor, do they generally moderate the efficiency of graft production. Therefore, many hairs may be lost due to waste.
The maximal number of grafts from strip surgery ranges between 4500 grafts to 8000 grafts in most strip harvesting clinics. In general, only those with ideal donor laxity and hair characteristics can achieve a total of 8000 grafts and it is worth pointing out that it is the scalps with greater laxity that form the widest strip scars. Using the mean follicular density of 81.37 and a length of 28 centimeters, the width of the donor area to produce 8000 intact follicular groups is 3.5 cm or 98 cm2 of a hair-bearing scalp. Suffice it to say that not many donor areas can tolerate such a voluminous amount of tissue excised especially if only a single scar is produced. Most donor areas probably tolerate a hair-bearing width between 2.875 cm and 3.0 cm of strip excision in the authors opinion.
Under exceedingly rare circumstances in a patient with average donor characteristics, the total maximum number of follicular groups possible from 119 cm sq is 9569 and the maximal number of hair is 22,679. This number far exceeds what most physicians have ever achieved in hair restoration surgery. This would leave only 42 cm2 of the donor area above the strip scar. The authors are unaware of any strip surgery that has achieved such a width of excision and this number of intact follicular groups.
Knowledge of individual patient characteristics such as their mean follicular density and their mean calculated density would allow the surgeon to gauge the efficiency of his procedure. For instance, if you produce fewer than 5400 total hairs from a strip of 28 cm2 in a patient with average follicular and calculated densities, then you have waste.
It is often stated among strip surgeons that you cannot produce more grafts from IFGH. It is generally accepted that you can remove up to 50% of a donor area and still have adequate coverage.5 If you consider that the average Caucasian donor area contains a mean follicular density of 16,641, one would on average be able to remove 8,321 follicular groups under the 50% rule of thumb. With IFGH you do not need to worry about scalp laxity and you do not need to worry about hiding a strip scar. Thus, you would almost always be able to achieve this number of grafts assuming that it is true that you can remove 50% of the donor density without producing thinness. The range of follicular densities in our 64 Caucasian patient study was 11,025 to 24,115 follicular groups. Accordingly, the range of potential follicular groups possible with IFGH is 5513 to 12,058 assuming you remove only 50% of the follicles. At the time of this publication, the authors are unaware of any patients who have had this many follicular groups extracted from their donor area, however. It is worth emphasizing that in IFGH the mean number of hairs per follicular group is 2.37, while it is 2.0 hairs per graft with strip surgery. Thus, with multiple strip procedures producing between 4500 to 8000 grafts, the average number of hairs possible is 9,000 to 16,000, while with IFGH the potential range of hairs on average is 13,066 to 28,577. The number of potential hairs with IFGH ardently exceeds the capacity of strip surgery and completely avoids the strip scar, the resulting donor area complications, and is independent of scalp laxity. Of course, IFGH averages 2.9 hairs per graft with the first 3000 grafts because it is possible to cherry-pick the grafts that contain the most hair. In other words, the first 3000 grafts harvested by IFGH will provide up to 8700 hairs on average, whereas, strip harvesting will provide an average of only 6000 hairs from 3000 grafts.
Donor density measurements between observers in both Caucasian and Asian patient populations have varied over the years based on the investigator and the method of collecting the data. Part of the reason for such variability is a lack of consistency in experimental study design. Many physicians have resorted to an estimation based on phototrichograms.6,15 Such studies are potentially flawed as it is difficult to verify the size of the surface area and it is impossible to accurately count the hairs in each follicular group. Accurate hair counts depend on a verifiable study area and on hand counting each hair in a follicular group. Photographs will always undercount the number of hairs in the follicular groups, as it is impossible to separate hairs in a photograph. Photographs also tend to record a surface area that is larger than the planned area because the photograph is taken at an angle to the surface of the skin. Furthermore, the scalp is a curved surface along a three-dimensional plane. Photographs are a two-dimensional representation of a three-dimensional surface.
In 1984, Headington defined the follicular unit as the pilosebaceous unit as disclosed at the mid-dermal level.7 In 1995 Bernstein, et al defined the follicular unit as the cluster of hair as disclosed on the surface of the skin.8 In medicine, it is not possible to give two completely different anatomical structures the same name. Therefore, we have more correctly identified the cluster of hair seen on the surface of the skin as the follicular group and completely avoided the use of the term follicular unit (except when used by other investigators) as the follicular unit is a term referring a structure identified in a histology laboratory with hematoxylin and eosin staining. Furthermore, the follicular groups on the surface of the skin are at times composed of more than one follicular unit.9 Until this study, follicular density has lacked such an in-depth assessment. This study breaks the entire donor area into 14 finite zones of specific size using a donor area template and measures the hair density and follicular density in each region. It still estimates the total follicular density but the number of individual measurements in 14 specific regions and the use of a donor template provides a far more accurate estimate of hair density, follicular density, and the calculated density than has been previously reported. The comparison of Korean and Caucasian populations using a standardized format allows for a much more accurate comparison of Caucasian and Asian hair densities than has been previously reported. Of course, multiple measurements within each of the 14 regions would have yielded more accurate information, as would accurate counts within a larger reticule than 10 mm2. The authors have found, however, that larger reticules lead to greater experimental error as it is more likely to overcount or undercount as it becomes more difficult to recognize which follicular groups have already been counted and which follicular groups have not been counted as the reticule size increases. Therefore, the authors feel that 10 mm2 is the ideal surface area for counting follicular density and hair density with a handheld device. Hair densities will be undercounted with any handheld device, as it is not possible to separate hairs existing from a single follicular canal. Therefore, some three or four hair follicular groups will be respectively counted as two and three hair follicular groups. Hair counts done after excision of the graft will be more accurate as these are done under a 10 X Meji EMT microscope with better optics and with the ability to both separate surface hairs and identify follicular bulbs giving rise to their respective hairs.
Prior papers estimated the donor area on the assumption that the donor area consisted of ¼ of the total scalp.10 The total scalp was estimated to be 80 square inches with the donor area comprising 20 square inches.10 It was further estimated in Caucasian patients that the scalp has an average hair density of 2.0 hairs per sq. millimeter and that the follicular density averaged one per square millimeter by numerous observers.2,8 Of course, the follicular density was originally determined by Headington in his evaluation of punch biopsies taken from the crown of cadavers.7 The crown area has a higher follicular density than the cumulative donor area, based on the authors’ research, and it is well known that skin contracts when it is excised. The contraction artificially leads to a higher density and accounts for some of the errors in Headington’s conclusions. It was further estimated that the average scalp contains about 100,000 hairs.10 The average donor area with an average density of 2 hairs per square millimeter was assumed to contain 25,000 hairs or 12,500 follicular units based on this assumption.8 It was further estimated that as hair density increased, the total amount of movable hair increased proportionately. We have shown in this paper that the mean hair density is lower than the mean calculated density in both Caucasian and Korean patients. Furthermore, hair density by itself does not predict follicular density. One must know both the hair density and the calculated density to accurately note the follicular density.
In years past, the donor area often consisted of the major and minor regions that are noted in this study. More recently, strip harvesting below the occipital notch has become uncommon because a strip was taken from below the occipital notch often results in a wider strip scar. The area above the occipital notch totals 161 square centimeters or 25 square inches. The minor regions total 42 square centimeters or 6.5 square inches, while the total donor area comprises 203 square centimeters or 31. 5 square inches. Today strip harvesting is typically done in the sweet spot between the superior border of the minor regions and the superior border of the major regions. Strip harvesting in the inferior regions has fallen out of favor because this region is prone to wide strip scars. IFGH expands the donor area into the minor regions and offers a greater potential for grafts in both Caucasian and Korean patients.
The Caucasian patient has a mean follicular density in the major regions of 13,133 and the mean follicular density in the minor region is 3,508. The mean calculated density (hairs per follicular group) is 2.37. This corresponds to a mean total of 31,125 hairs in the major region and 8314 hairs in the minor regions or a total of 39,439 hairs in the donor region.
In the Korean patient, the mean follicular density in the major regions is 12,527 and the mean follicular density in the minor region is 3191. The mean calculated density (hairs per follicular group) is 2.21. This computes to a mean total of 27,685 hairs in the major region and 7,052 hairs in the minor regions or a total of 34, 737 hairs in the donor region. Prior studies in Korean patients indicated a potential between 10,375 and 15, 250 hairs based on patient age
The mean number of hairs per follicular group in Korean patients undergoing IFGH was shown to be much higher in this study than in previous studies. Pathomvanich found the distribution of follicular units in 30 Asian patients undergoing strip harvesting to be 23.65% 1 hair FU, 63.82% 2 hair FU, 12.52% 3 hair FU, and 0-1% 4 hair FU.11 The 30 Korean patients studied in this paper revealed a much lower percentage of 1 hair FU and a much higher percentage of 3 hair FU and 4 hair FU. In addition rare 5 hair FU was noted. Dr. Yoo found that the occipital region of young male Koreans with androgenic alopecia had a follicular distribution of 38.9% 1 hair, 37.4% 2 hair, and 23% 3 hair groups.6 A comparison of IFGH, Dr. Pathomvanich, and Dr. Yoo is depicted in Table 9 and Figure 4. In a previous study of Korean patients, Lee found the following distribution with IFGH: 1.5% 1hair, 37.2% 2 hair, 51.7% 3hair, 9.3% 4 hair, 0.4% 4 hair, and 0% 6 hair.3 Clearly, more data is needed to more accurately predict the overall mean with IFGH in Korean patients, but the data continues to confirm that IFGH offers more hair per graft than strip surgery in Asian patients.
| 1 hair | 2 hair | 3 hair | 4 hair | 5 hair | 6 hair | |
| IFGH | 2.15 | 44.71 | 47.02 | 5.57 | 0.55 | 0 |
| Pathomvanich | 23.65 | 63.83 | 12.52 | 1 | 0 | 0 |
| Yoo | 38.9 | 37.4 | 23 | 0 | 0 | 0 |
Table 9. Comparison of the distribution of hair groupings as a percentage based on the number of hairs in each group in Asian patients pre-operatively, with strip surgery, and with IFGH.

Figure 4. Distribution of Follicular Group Size in Asian patients by three different investigators comparing the pre-operative donor area, strip harvesting, and IFGH.
Prior studies looking at the mean follicular density in Caucasians by Limmer noted 0.9/mm2, Bernstein and Rassman 1.0/mm2, and Cole 0.8/mm2.9,8,12 Prior literature in Korean patients suggested a range of 0.55 to 0.64 per mm2 depending on the age of the patient.13 In this study, the follicular density based on the total surface area of 203 square cm was 0.81 per mm2 in Caucasian and 0.75 per mm2 in Asian patients. This represents a much more similar follicular density than has been previously reported between Caucasian and Korean patients. Clearly data in this study far exceeds the estimates previously performed and shows that Koreans have far more hair in their donor regions than has been previously reported. Koreans are far better candidates for hair transplanted surgery than has been previously been reported based on this study.
Prior studies showed that Korean hair densities ranged from 0.83 to 1.22 hair per mm2.13 In this study, we found the mean hair density in Asian patients was 1.65 per mm2. Bernstein and Rassman suggested the mean hair density was 2.0 hair per mm2. In this study, the Caucasian hair density was 1.93 hairs per mm2.
The average number of hairs per graft with strip surgery in the Korean patient is 1.9 hairs.14 In IFGH the average number of hairs per graft is 2.53 in Korean patients. IFGH is particularly suited for the Korean patient as IFGH provides 0.62 more hairs per graft than does strip surgery. This results in better value to the Korean patient undergoing FUE and greater potential coverage with an equal number of grafts.
Previous studies have shown that the survival rates for IFGH are similar to those in strip harvesting and that transection rates with IFGH are generally less than in strip harvesting.3 Cumulatively, the data overwhelmingly supports IFGH as the method of choice in donor harvesting.
Conclusion
The authors have shown in numerous previous studies that the mean Caucasian follicular density is approximately 80 follicular groups per square centimeter. This study confirms the mean follicular density is similar to the authors’ previous findings. Using a similar protocol, this study showed that Korean hair density, follicular density, and calculated density are much higher than previously reported. In addition, this study shows that IFGH can produce a much higher percentage of grafts containing more than one hair in Korean patients. The results document that IFGH provides a much better solution for the Korean patient undergoing hair restoration surgery as the average IFGH graft contains 0.62 more hairs per graft than strip surgery provides in Korean patients.
Bibliography
- Unger W, Cole J, Donor Harvesting, Hair Transplantation. W.P. Unger and R.M. Shapiro, eds. Marcel Dekker: New York, 2004; 307-308.
- Rassman, WR, et al. Follicular unit extraction: minimally invasive surgery for hair transplantation. Dermatol Surg. 202: 28(8):720-27
- Cole, JP, Status of individual follicular group harvesting, Hair Transplant Forum International, Jan/Feb 2009; 20-24.
- Tykocinski, A, personal communication February 2009
- Marritt E. The death of the density debate. Dermatol Surg 1999;25:654-660.
- Yoo JH, Analysis of hair characteristics in Koreans using phototrichograms, Hair Transplantation. W.P. Unger and R.M. Shapiro, eds. Marcel Dekker: New York, 2004; 892-897.
- Headington JT. Transverse microscopic anatomy of the human scalp. Arch Dermatol 1984:120:449-456.
- Bernstein, RM, Rassman, WR, Szaniawski, W, Halperin, A, Follicular Transplantation, International Journal of Aesthetic and Restorative Surgery, Vol 3, 2, 1995, pp 119-132.
- Cole JP. Mathematics of follicular transplantation, ISHRS, Washington, DC 1998.
- Rassman WR, Carson S, Micrografting in Extensive Quantities, Dermatologic Surgery, Vol 21, 4, April 1995, pp 306-311.
- Pathomvanich, D, Hair Replacement in Asians, Stough, D, Haber, B. (eds) pp 149-156.
- Limmer BL. Personal communication 1998.
- Korea Dermatology Society, 43.
- Kuelachi, M. Review of the Asian hair surgery workshop. Hair Transplant Forum Intl. 17(3):94-95.
- Neidel, F, Bretschneider, P, Measuring hair density and mass, Hair Transplantation. W.P.Unger and R.M. Shapiro, eds. Marcel Dekker: New York 2004; 876-886